What is ana::tool event detection and how does it use UV-Vis spectroscopy to identify events?
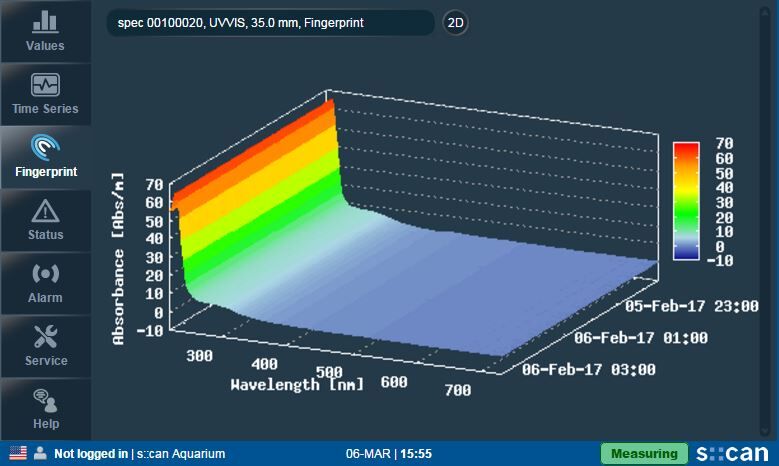
Ana::tool is a piece of event detection software that is embedded onto a s::can concube controller and works with s::can sensors such as the spectro::lyser.

It is frequently used in intake protection, pollution monitoring or in a distribution network.  It has two methods for identifying events, one called the ‘spectral alarm’ which uses the UV-Vis spectral absorption to identify and classify different types of events and the second is is called the ‘pattern alarm’ which uses the relationships between different parameter results to identify and classify different types of events.

Ana::tool spectral alarm

The spectral alarm uses the full (or part of) UV-Vis spectra to identify events that are outside of the normal variation in the water quality. 

The system is self-learning to account for variations in water quality such as seasonal effects. When the software identifies an event outside of the ‘normal’ conditions, it goes into alarm and seeks feedback from the user as to whether this was a real event or something that can be considered ‘normal’.  In giving this feedback, the software becomes ever more sensitive to real events.

An example

In this example, three events have been identified by the ana::tool event detection software as outside of the ‘normal’ conditions.

The alarm screen as shown when using ana::tool on a concube.

Event 1 occurred at 18.12 on the 7th June 2018 and lasted for approximately 90 minutes. By clicking on the time series button, we can compare the spectra to that which we’d expect to see in normal conditions.

As can be seen from the spectra, there is a significant difference at around 600nm during the event (the red spectra) compared to the normal spectra (the yellow spectra).  This would not have been picked up by monitoring individual parameters such as UV254 or colour.  In this case, it may be advisable to have a sample taken at this time for laboratory analysis to identify the cause. Once identified, the event can be classed as a real event which should prompt and alarm in the future and tagged as a particular type of event, e.g. pesticide pollution event. 

Looking at the second event, which started at 22.08 on the same day and lasted for about 20 minutes, a different spectrum can be seen.

In this event, we can see a spike around 380nm as well as elevated absorption in the UV region. This event might be deemed relatively normal in terms of the variation in water quality for the site but given it’s such a large spike in colour (true colour parameter increased from <10Hz to 60Hz) then it may be the case wish to notified of such events so that they can take appropriate treatment actions. If so, the event would be classed as a real event and in the future, an alarm would be raised should such conditions occur again.

The final event occurred overnight on the 7th June.
As can be seen, the colour levels have now dropped back down (to about 10Hz) but there is still some elevated UV absorption.  Site may classify this as normal variation with no additional treatment implications and as such the event should be tagged as a normal event and included in the ana::tool reference database. This ensures that such events do not prompt an alarm in the future.

Once each of these alarms are classified, the ana::tool event detection software alarms page is cleared and the system will automatically train itself to identify or ignore these events in the future, depending upon how they’ve been classified.

Ana::tool pattern alarm

The ana::tool pattern alarm function works in much the same way but instead of using the UV-Vis spectra as the mechanism for identifying events, it uses the parameter values and as such is more commonly used on sensors such as the i::scan, the pH::lyser, the condu::lyser etc.

The pattern alarm monitors the relationships between different parameters and if it identifies a set of relationships that are outside of the normal conditions, will go into alarm. For example, if used in a network, a small turbidity spike may be normal and not prompt any actions. If the turbidity spike is accompanied by a UV254 spike then you might want to investigate why, the pattern alarm is able to identify and differentiate between these different types of events.

Summary

Ana::tool event detection software is the most advanced event detection software available and has been used across the globe in various applications.  It is one of the few event detection systems assessed by the US-EPA who concluded that water quality events are possible with such systems. 

Contact PMA for further information on this US EPA assessment.

Click Here
Knowledgeable, experienced staff.

Need some advice or support? We’re here to help.

If you need a call back about how Process Measurement and Analysis can help you or have any questions at all please feel free to contact us at [email protected].  A member of our experienced team will contact you directly.

Close Menu

Talk to us

Call us on 01484 843 708

E-mail us

You can also contact us directly at [email protected]

Write to us

Process Measurement and Analysis Ltd, Brook Mills House, Carr Lane, Slaithwaite, Huddersfield, HD7 5BG United Kingdom